Search any question & find its solution
Question:
Answered & Verified by Expert
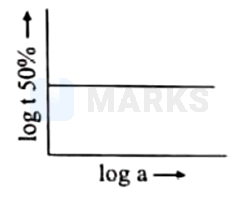
A graph plotted between log vs. log concentration is a straight line. What conclusion can you draw from the given graph
Options:
Solution:
1451 Upvotes
Verified Answer
The correct answer is:
or
so slope
or
or
Looking for more such questions to practice?
Download the MARKS App - The ultimate prep app for IIT JEE & NEET with chapter-wise PYQs, revision notes, formula sheets, custom tests & much more.