Search any question & find its solution
Question:
Answered & Verified by Expert
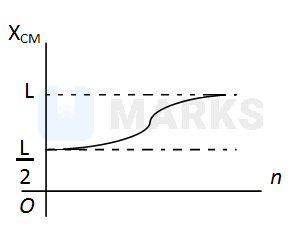
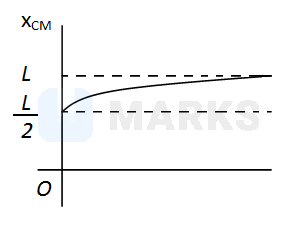
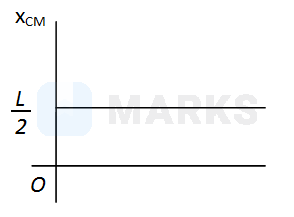
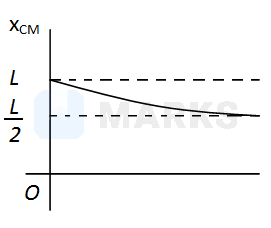
A thin rod of length is lying along the x-axis with its ends at = 0 and = . Its linear density ( mass/length ) varies with as where can be zero or any positive number. If the position of the centre of mass of the rod is plotted against , which of the following graphs best approximates the dependence of on ?
Options:
- A
- B
- C
- D
Solution:
2396 Upvotes
Verified Answer
The correct answer is:
The variation of the mass with is given by
If the rod has the same density as at = 0 i.e., = 0, therefore uniform, the cenre of mass would have been at . As the density increases with length, the centre of mass shifts towards the right. Therefore it can only be (b).
Looking for more such questions to practice?
Download the MARKS App - The ultimate prep app for IIT JEE & NEET with chapter-wise PYQs, revision notes, formula sheets, custom tests & much more.