Search any question & find its solution
Question:
Answered & Verified by Expert

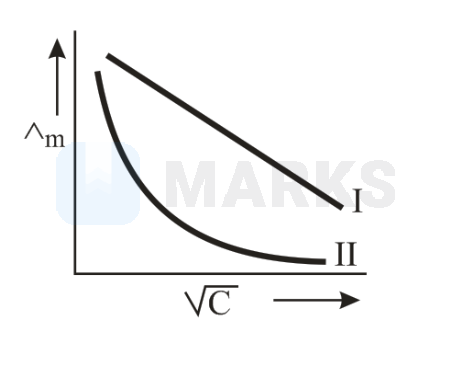
Above plot represents the variation of molar conductance against (where C = molar concentration of the electrolyte). Select the correct option among following
Solution:
2491 Upvotes
Verified Answer
The correct answer is:
I is for strong electrolyte and II for weak electrolyte
Here I is for strong electrolyte and II for weak electrolyte as Linear plot corresponds to strong electrolyte while the exponential curve corresponds to weak electrolyte.
Looking for more such questions to practice?
Download the MARKS App - The ultimate prep app for IIT JEE & NEET with chapter-wise PYQs, revision notes, formula sheets, custom tests & much more.