Search any question & find its solution
Question:
Answered & Verified by Expert
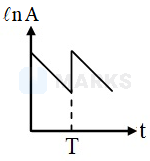
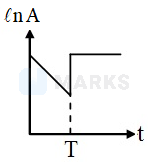
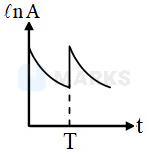
At the time , some radioactive gas is injected into a sealed vessel. At the time , some more of the same gas is injected into the same vessel. Which one of the following graphs, best represents the variation of the logarithm of the activity of the gas with time ?
Options:
Solution:
1562 Upvotes
Verified Answer
The correct answer is:


Take log both side

Looking for more such questions to practice?
Download the MARKS App - The ultimate prep app for IIT JEE & NEET with chapter-wise PYQs, revision notes, formula sheets, custom tests & much more.

