Search any question & find its solution
Question:
Answered & Verified by Expert
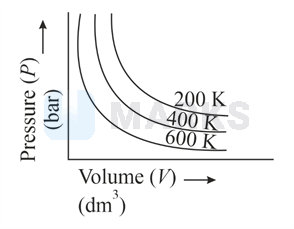
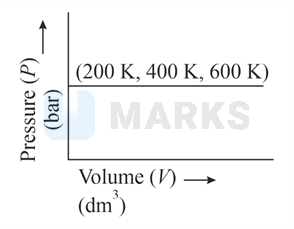
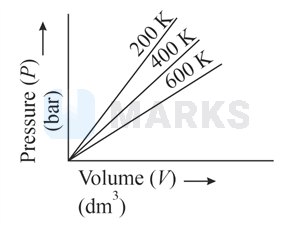
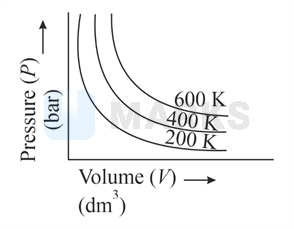
Choose the correct option for graphical representation of Boyle's law, which shows a graph of pressure vs. volume of a gas at different temperatures:
- A
- B
- C
- D
Solution:
2590 Upvotes
Verified Answer
The correct answer is:
According to Boyle's law
constant ( and constant)
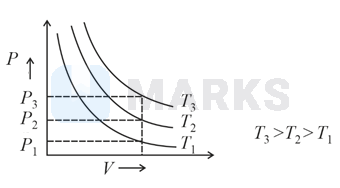
for any fixed volume
Therefore,
Looking for more such questions to practice?
Download the MARKS App - The ultimate prep app for IIT JEE & NEET with chapter-wise PYQs, revision notes, formula sheets, custom tests & much more.