Search any question & find its solution
Question:
Answered & Verified by Expert
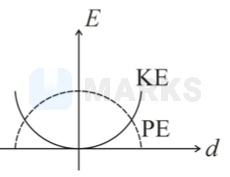
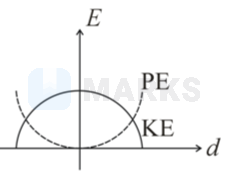
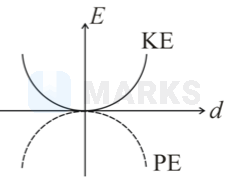
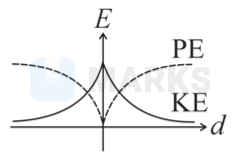
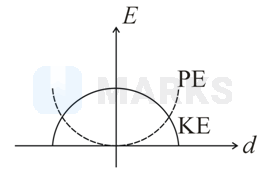
For a simple pendulum, a graph is plotted between its kinetic energy \( (K . E .) \) and potential energy \( (P . E .) \) against its
displacement \( d \). Which one of the following represents these correctly?
Options:
displacement \( d \). Which one of the following represents these correctly?
- A
- B
- C
- D
Solution:
1647 Upvotes
Verified Answer
The correct answer is:
In simple harmonic motion, kinetic energy is given by,
.
So, the graph is a downward parabola.
Here, amplitude of simple harmonic motion
and displacement from mean position in simple harmonic motion
and.
So, the graph is an upward parabola.
At mean,
and potential energy is, .
At extreme positions,
.
Looking for more such questions to practice?
Download the MARKS App - The ultimate prep app for IIT JEE & NEET with chapter-wise PYQs, revision notes, formula sheets, custom tests & much more.