Search any question & find its solution
Question:
Answered & Verified by Expert
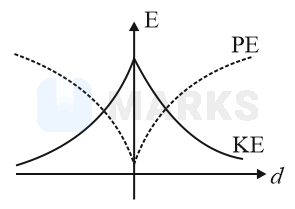
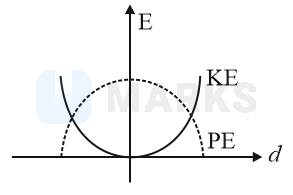
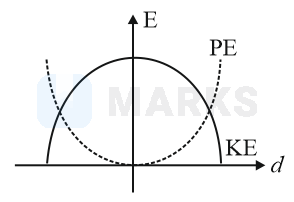
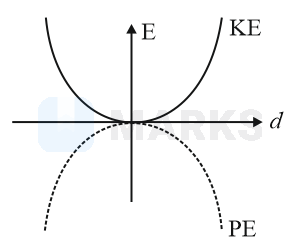
For a simple pendulum, a graph is plotted between its kinetic energy (K.E.) and potential energy (P.E.) against its displacement d. which one of the following represents these correctly? (graphs are schematic and not drawn to scale)
Options:
- A
- B
- C
- D
Solution:
2915 Upvotes
Verified Answer
The correct answer is:
For simple pendulum performing the simple harmonic motion, displacement, ,
This represents a downward parabola, , . . This represents an upward parabola. On plotting graphs of potential energy & kinetic energy.
This represents a downward parabola, , . . This represents an upward parabola. On plotting graphs of potential energy & kinetic energy.
Looking for more such questions to practice?
Download the MARKS App - The ultimate prep app for IIT JEE & NEET with chapter-wise PYQs, revision notes, formula sheets, custom tests & much more.