Search any question & find its solution
Question:
Answered & Verified by Expert
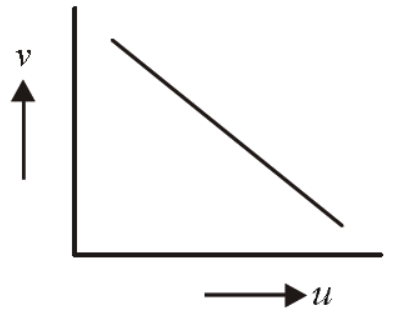
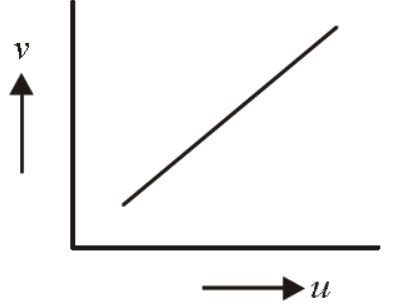
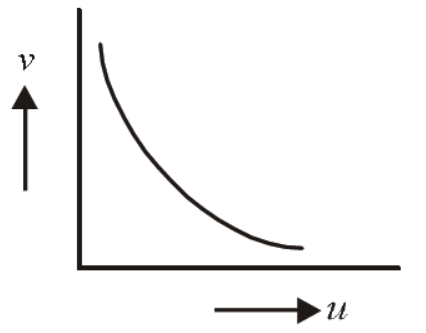
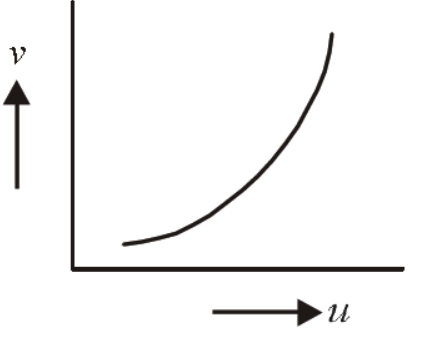
In an experiment to find the focal length of a concave mirror a graph is drawn between the magnitudes of $u$ and $v$. The graph looks like
Options:
- A
- B
- C
- D
Solution:
1296 Upvotes
Verified Answer
The correct answer is:
No Solution Available
Looking for more such questions to practice?
Download the MARKS App - The ultimate prep app for IIT JEE & NEET with chapter-wise PYQs, revision notes, formula sheets, custom tests & much more.