Search any question & find its solution
Question:
Answered & Verified by Expert
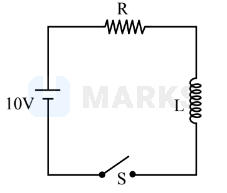
In the circuit shown, the switch is closed at time $\mathrm{t}=0$.

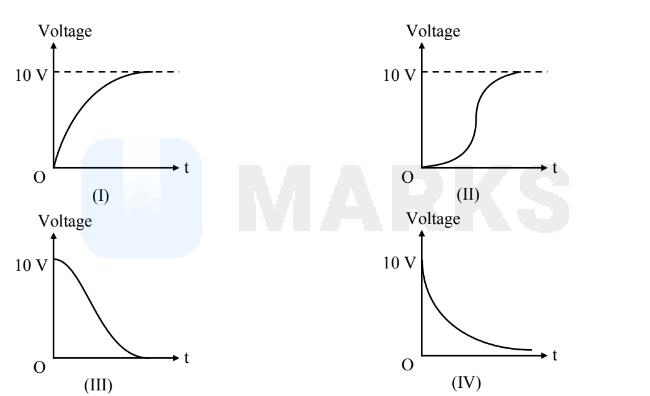
Which of the graphs shown below best represents the voltage across the inductor, as seen on an oscilloscope ?
Options:

Which of the graphs shown below best represents the voltage across the inductor, as seen on an oscilloscope ?

Solution:
2028 Upvotes
Verified Answer
The correct answer is:
IV
$|\mathrm{e}|=\frac{\mathrm{V}}{\mathrm{R}} \mathrm{e}^{-\frac{\mathrm{R}}{\mathrm{L}} \times \mathrm{t}}$


Looking for more such questions to practice?
Download the MARKS App - The ultimate prep app for IIT JEE & NEET with chapter-wise PYQs, revision notes, formula sheets, custom tests & much more.