Search any question & find its solution
Question:
Answered & Verified by Expert
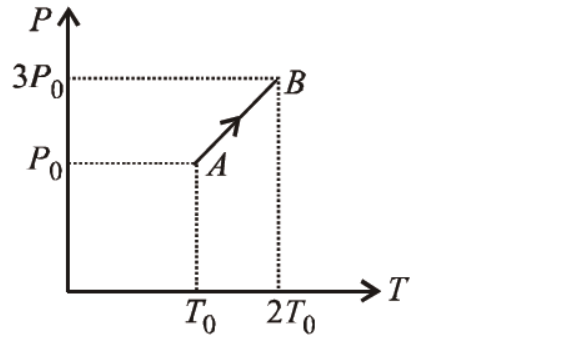
Pressure versus temperature graph of an ideal gas is as shown in figure. Density of the gas at point $A$ is $\rho_0$. Density at point $B$ will be
Options:
Solution:
2640 Upvotes
Verified Answer
The correct answer is:
$\frac{3}{2} \rho_0$
$$
\begin{aligned}
& \text { } \rho=\frac{P M}{R T} \text { or } \rho \propto \frac{P}{T} \\
& \left(\frac{P}{T}\right)_A=\frac{P_0}{T_0} \text { and }\left(\frac{P}{T}\right)_B=\frac{3}{2}\left(\frac{P_0}{T_0}\right) \\
& \left(\frac{P}{T}\right)_B=\frac{3}{2}\left(\frac{P}{T}\right)_A \\
& \therefore \quad \rho_B=\frac{3}{2} \rho_A=\frac{3}{2} \rho_0
\end{aligned}
$$
Looking for more such questions to practice?
Download the MARKS App - The ultimate prep app for IIT JEE & NEET with chapter-wise PYQs, revision notes, formula sheets, custom tests & much more.