Search any question & find its solution
Question:
Answered & Verified by Expert
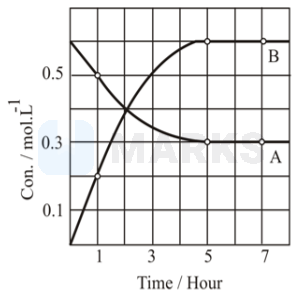
The concentration vs time graph for the reaction \( \mathrm{A} \rightleftharpoons \mathrm{nB} \), is presented in the figure. Determine the value of \( \mathrm{n} \).
Solution:
2596 Upvotes
Verified Answer
The correct answer is:
2
Initially in the container, only the reactant is present. After equilibrium is established.
At equilibrium, the rate of forward reaction becomes equal to the rate of backward reaction and the net rate of the reaction is zero.
Looking for more such questions to practice?
Download the MARKS App - The ultimate prep app for IIT JEE & NEET with chapter-wise PYQs, revision notes, formula sheets, custom tests & much more.