Search any question & find its solution
Question:
Answered & Verified by Expert
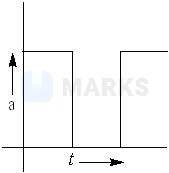
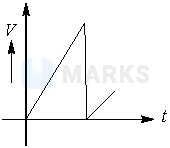
The figure shows the acceleration-time graph of a particle. Which of the following represents the corresponding velocity-time graph? ( consider initial velocity zero )
Options:
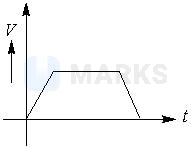
- A
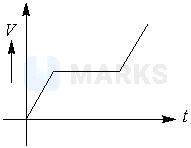
- B
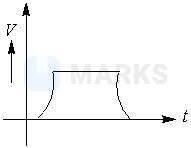
- C
- D
Solution:
2547 Upvotes
Verified Answer
The correct answer is:
Since acceleration is constant, therefore there is uniform increase in velocity. So, the graph is a straight line slopping upward to the right. When acceleration becomes zero, velocity is constant. So graph is a straight line parallel to the time-axis.
Looking for more such questions to practice?
Download the MARKS App - The ultimate prep app for IIT JEE & NEET with chapter-wise PYQs, revision notes, formula sheets, custom tests & much more.