Search any question & find its solution
Question:
Answered & Verified by Expert
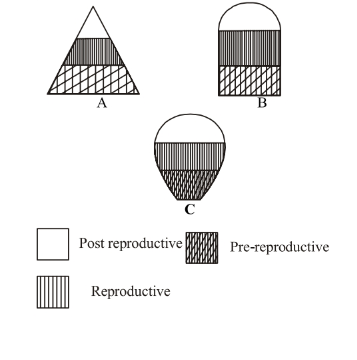
The following diagrams are the age pyramids of different populations. Comment on the status of these populations.


Solution:
1710 Upvotes
Verified Answer
Figure $\mathbf{A}$ is a 'pyramid' shaped age pyramid. In this figure, the base, i.e., pre-reproductive stage is very large as compared with the reproductive and post-reproductive stages of the population. This type of age pyramid indicates that the population increase would be rapid.
Figure $\mathbf{B}$ is an 'inverted bell' shaped pyramid. In this figure the pre-reproductive and reproductive stages are same. Stable population is represented by this type of age structure.
Figure $\mathbf{C}$ is 'urn' shaped pyramid. In this figure, the prereproductive and reproductive stages are less compared to the post-reproductive stages of this population. In this population more older people are present. This type of age structure indicates declining population.
Looking for more such questions to practice?
Download the MARKS App - The ultimate prep app for IIT JEE & NEET with chapter-wise PYQs, revision notes, formula sheets, custom tests & much more.