Search any question & find its solution
Question:
Answered & Verified by Expert
The graph between the time period and the length of a simple pendulum is
Options:
Solution:
2165 Upvotes
Verified Answer
The correct answer is:
parabola
The time period of a simple pendulum is
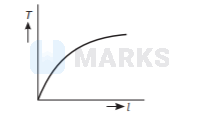
$$
T=2 \pi \sqrt{\frac{l}{g}}
$$
Here, $l$ is the length of the pendulum. On squaring both sides
$$
\begin{aligned}
& T^{2}=\frac{4 \pi^{2} l}{g} \\
\Rightarrow \quad & T^{2} \propto l
\end{aligned}
$$
So, the graph between time period $T$ and length $l$ of the pendulum is a parabola.
$$
T=2 \pi \sqrt{\frac{l}{g}}
$$
Here, $l$ is the length of the pendulum. On squaring both sides
$$
\begin{aligned}
& T^{2}=\frac{4 \pi^{2} l}{g} \\
\Rightarrow \quad & T^{2} \propto l
\end{aligned}
$$
So, the graph between time period $T$ and length $l$ of the pendulum is a parabola.
Looking for more such questions to practice?
Download the MARKS App - The ultimate prep app for IIT JEE & NEET with chapter-wise PYQs, revision notes, formula sheets, custom tests & much more.