Search any question & find its solution
Question:
Answered & Verified by Expert
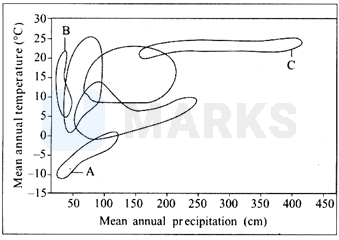
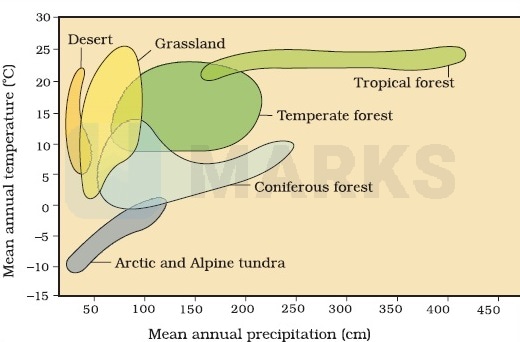
The graph given below is showing biome distribution with respect to annual temperature and precipitation. Identify A, B, and C, respectively.
Options:
Solution:
2345 Upvotes
Verified Answer
The correct answer is:
A–Arctic tundra; B–Desert; C–Tropical forest
Looking for more such questions to practice?
Download the MARKS App - The ultimate prep app for IIT JEE & NEET with chapter-wise PYQs, revision notes, formula sheets, custom tests & much more.