Search any question & find its solution
Question:
Answered & Verified by Expert
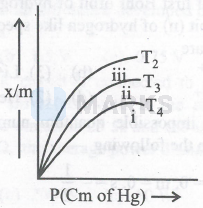
The graph given below is showing the relation between the extent of adsorption $(\mathrm{x} / \mathrm{m})$ and Pressure at different temperatures. The correct order of temperatures for curves $\mathrm{i}$, ii and iii is
Options:
Solution:
2549 Upvotes
Verified Answer
The correct answer is:
$\mathrm{T}_4>\mathrm{T}_3>\mathrm{T}_2$
From the graph it is obvious that the extent of adsorption $(\mathrm{x} / \mathrm{m})$ follows the order $\mathrm{T}_2>\mathrm{T}_3>\mathrm{T}_4$.
The extent of physisorption decreases with an increase in temperature.
Thus, $\mathrm{T}_4>\mathrm{T}_3>\mathrm{T}_2$.
The extent of physisorption decreases with an increase in temperature.
Thus, $\mathrm{T}_4>\mathrm{T}_3>\mathrm{T}_2$.
Looking for more such questions to practice?
Download the MARKS App - The ultimate prep app for IIT JEE & NEET with chapter-wise PYQs, revision notes, formula sheets, custom tests & much more.