Search any question & find its solution
Question:
Answered & Verified by Expert
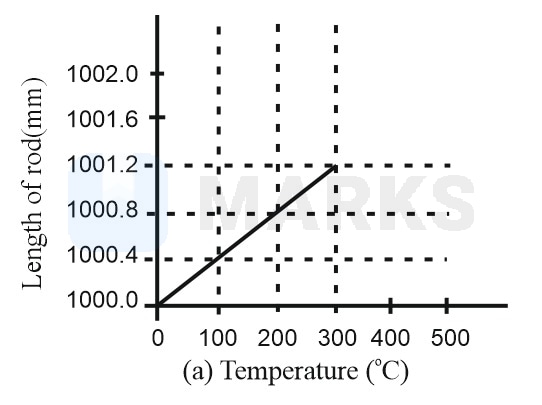
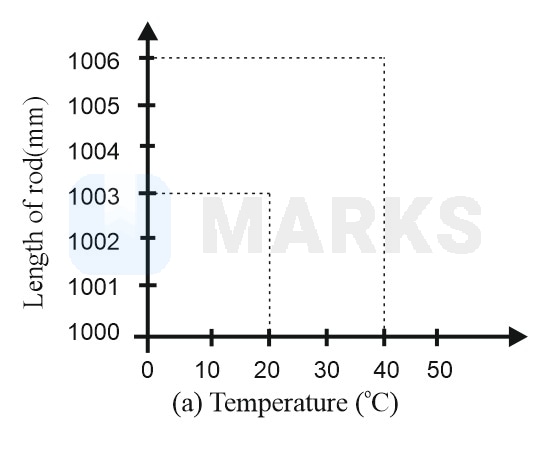
The graph of elongation of a rod of a substance with temperature rise is shown in the first graph. A liquid contained in a cylindrical vessel made out of substance (graduated in at is heated gradually. The readings of the liquid level in the vessel corresponding to different temperatures are shown in the second graph. The real coefficient of volume expansion of the liquid is
Options:
Solution:
2832 Upvotes
Verified Answer
The correct answer is:
From the graph (a),
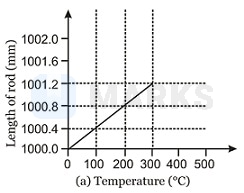
the slope of line is
But
As shown in graph (b),
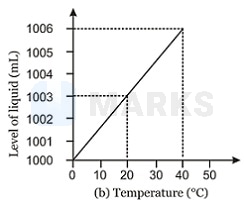
the slop of line is
But,
Since,
the slope of line is
But
As shown in graph (b),
the slop of line is
But,
Since,
Looking for more such questions to practice?
Download the MARKS App - The ultimate prep app for IIT JEE & NEET with chapter-wise PYQs, revision notes, formula sheets, custom tests & much more.