Search any question & find its solution
Question:
Answered & Verified by Expert
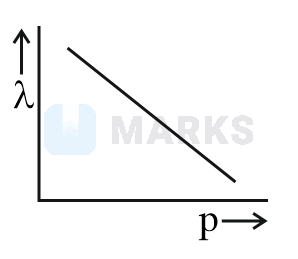
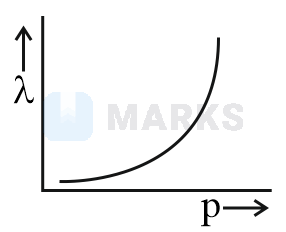
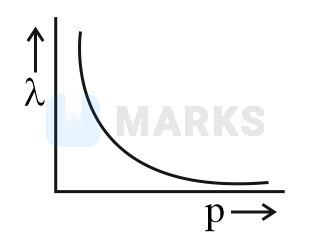
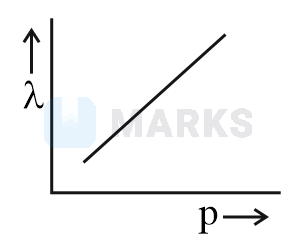
The graph which shows the variation of the de Broglie wavelength of a particle and its associated momentum is :
Options:
- A
- B
- C
- D
Solution:
1472 Upvotes
Verified Answer
The correct answer is:
As per de Broglie,
which is similar to expression.
Looking for more such questions to practice?
Download the MARKS App - The ultimate prep app for IIT JEE & NEET with chapter-wise PYQs, revision notes, formula sheets, custom tests & much more.