Search any question & find its solution
Question:
Answered & Verified by Expert
The probability density plots of $1 s$ and $2 s$ orbitals are given in figure.
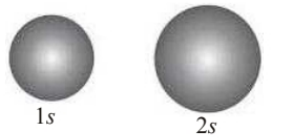
The density of dots in a region represents the probability density of finding electrons in the region. On the basis of above diagram which of the following statements is incorrect?
Options:
The density of dots in a region represents the probability density of finding electrons in the region. On the basis of above diagram which of the following statements is incorrect?
Solution:
1744 Upvotes
Verified Answer
The correct answer is:
The probability density of electrons for $2 s$ orbital decreases uniformly as distance from the nucleus increases.
The probability density of electrons for $2 s$ orbital decreases uniformly as distance from the nucleus increases.
The probability density of electrons in $2 s$ orbital first increases then decreases and after that it increases again as distance increases from nucleus.
Looking for more such questions to practice?
Download the MARKS App - The ultimate prep app for IIT JEE & NEET with chapter-wise PYQs, revision notes, formula sheets, custom tests & much more.