Search any question & find its solution
Question:
Answered & Verified by Expert
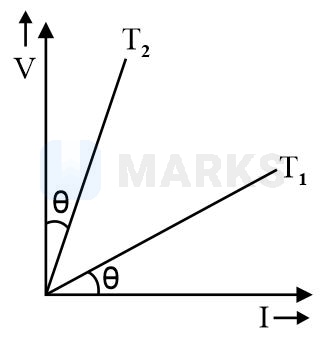
The graphs for a conductor at temperature and are shown in the figure. is proportional to
Options:
Solution:
1670 Upvotes
Verified Answer
The correct answer is:
The slope of graph gives resistance,
and
and
Looking for more such questions to practice?
Download the MARKS App - The ultimate prep app for IIT JEE & NEET with chapter-wise PYQs, revision notes, formula sheets, custom tests & much more.