Search any question & find its solution
Question:
Answered & Verified by Expert
The variation of molar conductively with concentration of an electrolyte (X) in aqueous solution is shown in the given figure.
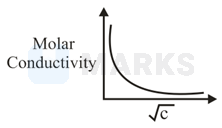
The electrolyte X is :
Solution:
2266 Upvotes
Verified Answer
The correct answer is:
Graph represent variation of with respect to for weak electrolyte.
Looking for more such questions to practice?
Download the MARKS App - The ultimate prep app for IIT JEE & NEET with chapter-wise PYQs, revision notes, formula sheets, custom tests & much more.