Search any question & find its solution
Question:
Answered & Verified by Expert
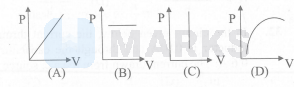
Which of the following graphs between pressure (P) and volume (V) correctly shows isochoric changes?
Options:
Solution:
1186 Upvotes
Verified Answer
The correct answer is:
C
Std.12|Ch-4|Subtopic-4.7
Looking for more such questions to practice?
Download the MARKS App - The ultimate prep app for IIT JEE & NEET with chapter-wise PYQs, revision notes, formula sheets, custom tests & much more.