Search any question & find its solution
Question:
Answered & Verified by Expert
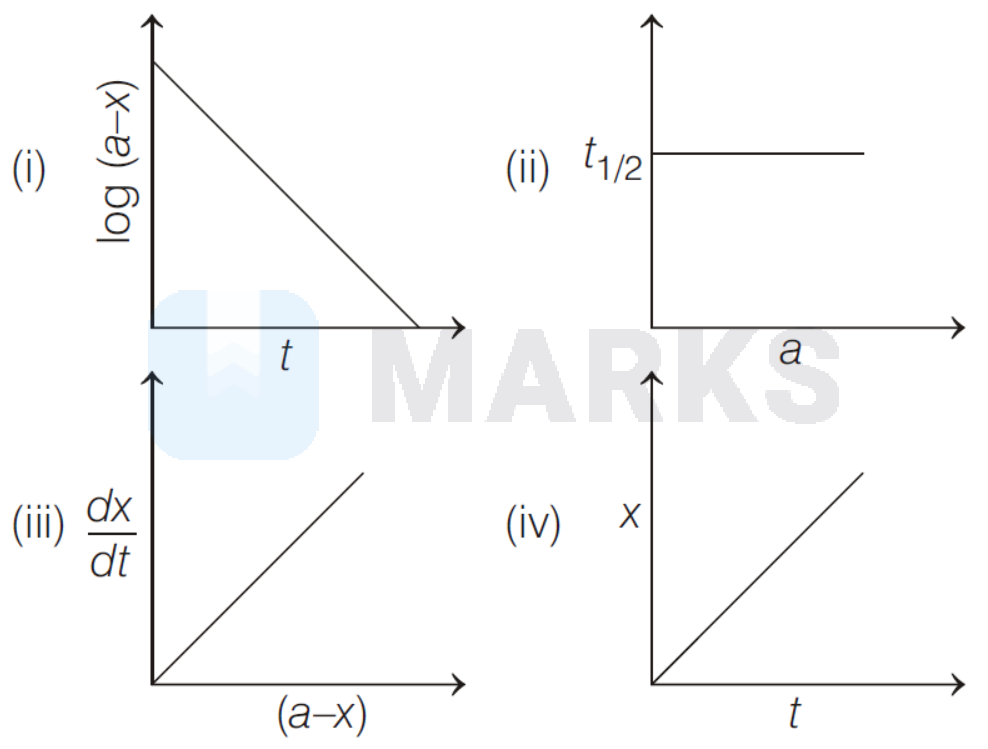
Which of the following graphs represent a first order reaction $(a=$ initial concentration of reactant, $x=$ concentration of reactant consumed, $t=$ time)?
Options:
Solution:
1642 Upvotes
Verified Answer
The correct answer is:
(i), (ii)
For a first order reaction
$$
\text { Rate }=-\frac{\Delta[A]}{\Delta t}=k[A]
$$
It is a straight line plot with negative slope when concentration of reactant is considered as in (i) and half-life for first order is independent from concentration, as in plot (ii).
$$
\text { Rate }=-\frac{\Delta[A]}{\Delta t}=k[A]
$$
It is a straight line plot with negative slope when concentration of reactant is considered as in (i) and half-life for first order is independent from concentration, as in plot (ii).
Looking for more such questions to practice?
Download the MARKS App - The ultimate prep app for IIT JEE & NEET with chapter-wise PYQs, revision notes, formula sheets, custom tests & much more.