Search any question & find its solution
Question:
Answered & Verified by Expert
A graph of $x$ versus $t$ is shown in figure. Choose correct alternatives from below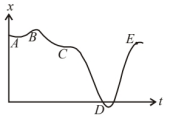
Options:
Solution:
1235 Upvotes
Verified Answer
The correct answers are:
The particle was released from rest at $t=0$
,
Average velocity for the motion between $A$ and $D$ is positive
,
The speed at $D$ exceeds that at $E$
The particle was released from rest at $t=0$
,
Average velocity for the motion between $A$ and $D$ is positive
,
The speed at $D$ exceeds that at $E$
According to the given diagram, the graph $(x-t)$ is parallel to time axis so, $v=\frac{d x}{d t}=0$ As the starting point is $A$ so, we can say that the particle is starting from rest. After $A$, slope increase so velocity increases, verity (a) option. If $a$ implies that acceleration $a=0$ so it discards option (b), and verfies the option (c). As direction of acceleration changes so, we can say that it may be zero in between.
From the graph it is clear that
$\mid$ slope at $D|>|$ slope at $E \mid$
Hence, speed at $D$ will be more than at $E$.
From the graph it is clear that
$\mid$ slope at $D|>|$ slope at $E \mid$
Hence, speed at $D$ will be more than at $E$.
Looking for more such questions to practice?
Download the MARKS App - The ultimate prep app for IIT JEE & NEET with chapter-wise PYQs, revision notes, formula sheets, custom tests & much more.