Search any question & find its solution
Question:
Answered & Verified by Expert
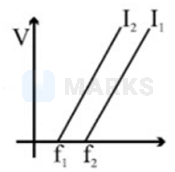
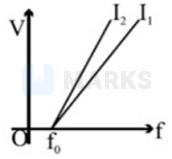
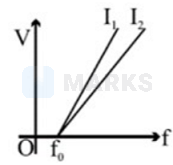
A photoelectric experiment is performed at two different light intensities and . Choose the correct graph showing the variation of stopping potential versus frequency of light.
Options:
- A
- B
- C
- D None of these
Solution:
1720 Upvotes
Verified Answer
The correct answer is:
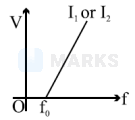
None of these
The value of stopping potential depends on the maximum kinetic energy of the photo-electron and thus it is independent of the intensity of light. Therefore, none of the graph shown is correct. The correct graph is shown in the figure.
Looking for more such questions to practice?
Download the MARKS App - The ultimate prep app for IIT JEE & NEET with chapter-wise PYQs, revision notes, formula sheets, custom tests & much more.