Search any question & find its solution
Question:
Answered & Verified by Expert
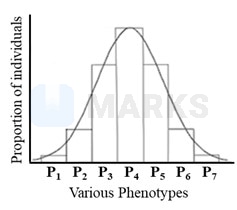
Observe the following graph representing the offsprings produced at the end of a cross. State the correct statement regarding this.
Options:
Solution:
2630 Upvotes
Verified Answer
The correct answer is:
It represents polygenic inheritance controlled by three genes
In the given graph, there are 7 phenotypes. The proportion of first and seventh phenotypes is the same. The proportion of second and sixth phenotypes is the same. The proportion of third and fifth phenotypes is the same. The proportion of the fourth phenotype is different and is maximum. This type of distribution is called a normal distribution. This is seen in polygenic inheritance or quantitative inheritance, which shows continuous variations. Since it has seven phenotypes, this character is controlled by 3 genes (example: human skin colour). When two mulattoes interbreed (AbBbCc x AaBbCc), they produce various shades of skin colour in the ratio 1 : 6 : 15 : 20 : 15 : 6: 1
Looking for more such questions to practice?
Download the MARKS App - The ultimate prep app for IIT JEE & NEET with chapter-wise PYQs, revision notes, formula sheets, custom tests & much more.