Search any question & find its solution
Question:
Answered & Verified by Expert
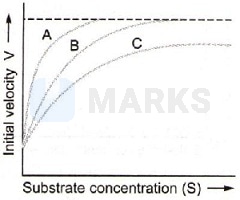
The figure given below shows three velocity substrate concentration curves for an enzyme reaction. What do the curves A, B and C depict respectively?
Options:
Solution:
1732 Upvotes
Verified Answer
The correct answer is:
A-normal enzyme reaction, B-competitive inhibition, C-non-competitive inhibition
In the figure given in question, curve a shows normal enzyme reaction while curve b shows a competitive inhibition reaction, in which the inhibitor resembles the substrate molecules, bind to the active site of the enzyme. Due to its close structural similarity with the substrate, the inhibitor competes with the substrate for the substrate-binding site of the enzyme. Consequently, the substrate cannot bind and as a result, the enzyme action declines.
Curve c shows non-competitive inhibition reaction, in which the inhibitor binds to a part of the enzyme or enzyme-substrate complex, other than the active site, known as the allosteric site. In such a case, the inhibitor reduces the activity of the enzyme and binds equally well to the enzyme whether or not it has already bound the substrate.
Curve c shows non-competitive inhibition reaction, in which the inhibitor binds to a part of the enzyme or enzyme-substrate complex, other than the active site, known as the allosteric site. In such a case, the inhibitor reduces the activity of the enzyme and binds equally well to the enzyme whether or not it has already bound the substrate.
Looking for more such questions to practice?
Download the MARKS App - The ultimate prep app for IIT JEE & NEET with chapter-wise PYQs, revision notes, formula sheets, custom tests & much more.