Search any question & find its solution
Question:
Answered & Verified by Expert
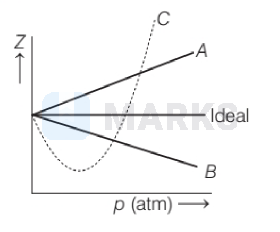
The given graph represents the variation of compressibility factor $(Z)=\frac{p V}{n R T}$, for three real gases $A, B$ and $C$. Identify the only incorrect statement.
Options:
Solution:
2526 Upvotes
Verified Answer
The correct answer is:
For the gas $B, b=0$ and its dependence on $p$ is linear at all pressure.
For the gas $B, b=0$ and its dependence on $p$ is linear at all pressure.
From the graph it is clear that, the value of ' $Z$ ' decreases with increase of pressure. We can explain as follows on the basis of van der Waals' equation.
At high pressure, when ' $p$ ' is large, $V$ will be small and one cannot ignore ' $b$ ' in comparison to $V$. However, the team $a / V^2$ may be considered negligible in comparison to ' $p$ ' in van der Waals' equation.
$\left(p+\frac{a}{V^2}\right)(V-b)=n R T$
$p(V-b)=n R T$
$\Rightarrow \quad p V-p b=n R T$
or $\frac{p V}{n R T}=1+\frac{p b}{n R T}$
or $Z=1+\frac{p b}{n R T}$
Thus, $Z$ is greater than 1. As pressure is increased (at constant $T$ ), the factor $\frac{p b}{n R T}$ increases. This explains why after minima in the curves, $Z$ increase continuously with pressure. Hence, the only incorrect statement is (b).
Looking for more such questions to practice?
Download the MARKS App - The ultimate prep app for IIT JEE & NEET with chapter-wise PYQs, revision notes, formula sheets, custom tests & much more.