Search any question & find its solution
Question:
Answered & Verified by Expert
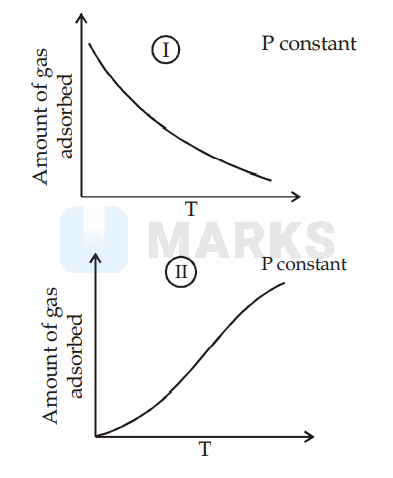
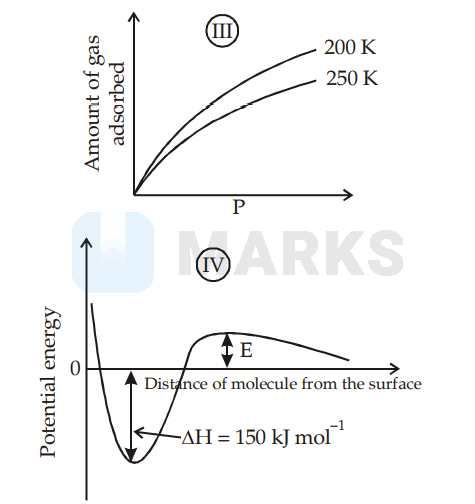
The given graphs/data I, II, III and IV represent general trends observed for different physisorption and chemisorption processes under mild conditions of temperature and presure. Which of the following choice(s) about I, II, III and IV is (are) correct?
Options:
Solution:
1917 Upvotes
Verified Answer
The correct answers are:
I is physisorption and II is chemisorption, IV is chemisorption and II is chemisorption
Graph (I) and (III) represent physisorption because, in physisorption, the amount of adsorption decreases with the increase of temperature and increases with the increase of pressure.
Graph (II) represent chemisorption, because in chemisorption amount of adsorption increases with the increase of temperature. Graph (IV) is showing the formation of a chemical bond, hence chemisorption.
Graph (II) represent chemisorption, because in chemisorption amount of adsorption increases with the increase of temperature. Graph (IV) is showing the formation of a chemical bond, hence chemisorption.
Looking for more such questions to practice?
Download the MARKS App - The ultimate prep app for IIT JEE & NEET with chapter-wise PYQs, revision notes, formula sheets, custom tests & much more.