Search any question & find its solution
Question:
Answered & Verified by Expert
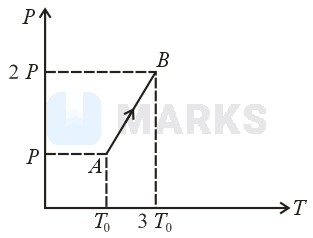
The pressure versus temperature graph of an ideal gas is shown in the figure below. If the density of gas at point is , then the density of the gas at point will be
Solution:
1990 Upvotes
Verified Answer
The correct answer is:
Given, density of gas at point
General equation for an ideal gas
[mass, molecular mass]
[where density ]
Applying Equation. (i) at point and , respectively.
From Equations. (ii) and (iii), we get
Looking for more such questions to practice?
Download the MARKS App - The ultimate prep app for IIT JEE & NEET with chapter-wise PYQs, revision notes, formula sheets, custom tests & much more.