Search any question & find its solution
Question:
Answered & Verified by Expert
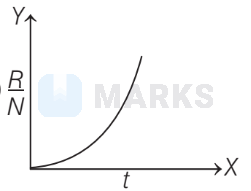
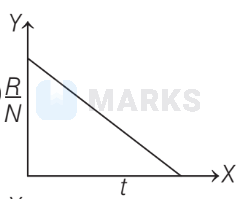
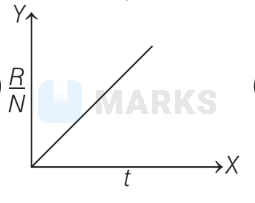
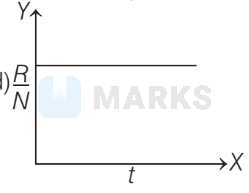
The rate of disintegration of a radioactive sample is $R$ and the number of atoms present at any time $t$ is $N$. When $\frac{R}{N}$ is taken along $Y$-axis and $t$ is taken along $X$-axis, the correct graphs is
Options:
- A
- B
- C
- D
Solution:
2324 Upvotes
Verified Answer
The correct answer is:
Law of radioactive decay is given as,
$\frac{d N}{d t}=-\lambda N$
where, $\frac{d N}{d t}=$ rate of disintegration
So,
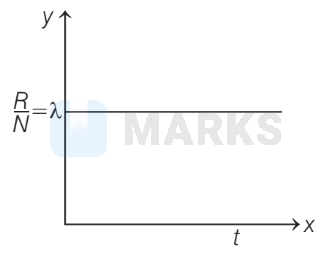
$R=-\lambda N \Rightarrow \frac{R}{N}=-\lambda=\text { constant }$
where, $\lambda=$ decay constant
So, the graph $\frac{R}{N}$ versus $t$ is as,
So, the correct graph shown in option (d).
$\frac{d N}{d t}=-\lambda N$
where, $\frac{d N}{d t}=$ rate of disintegration
So,
$R=-\lambda N \Rightarrow \frac{R}{N}=-\lambda=\text { constant }$
where, $\lambda=$ decay constant
So, the graph $\frac{R}{N}$ versus $t$ is as,
So, the correct graph shown in option (d).
Looking for more such questions to practice?
Download the MARKS App - The ultimate prep app for IIT JEE & NEET with chapter-wise PYQs, revision notes, formula sheets, custom tests & much more.