Search any question & find its solution
Question:
Answered & Verified by Expert
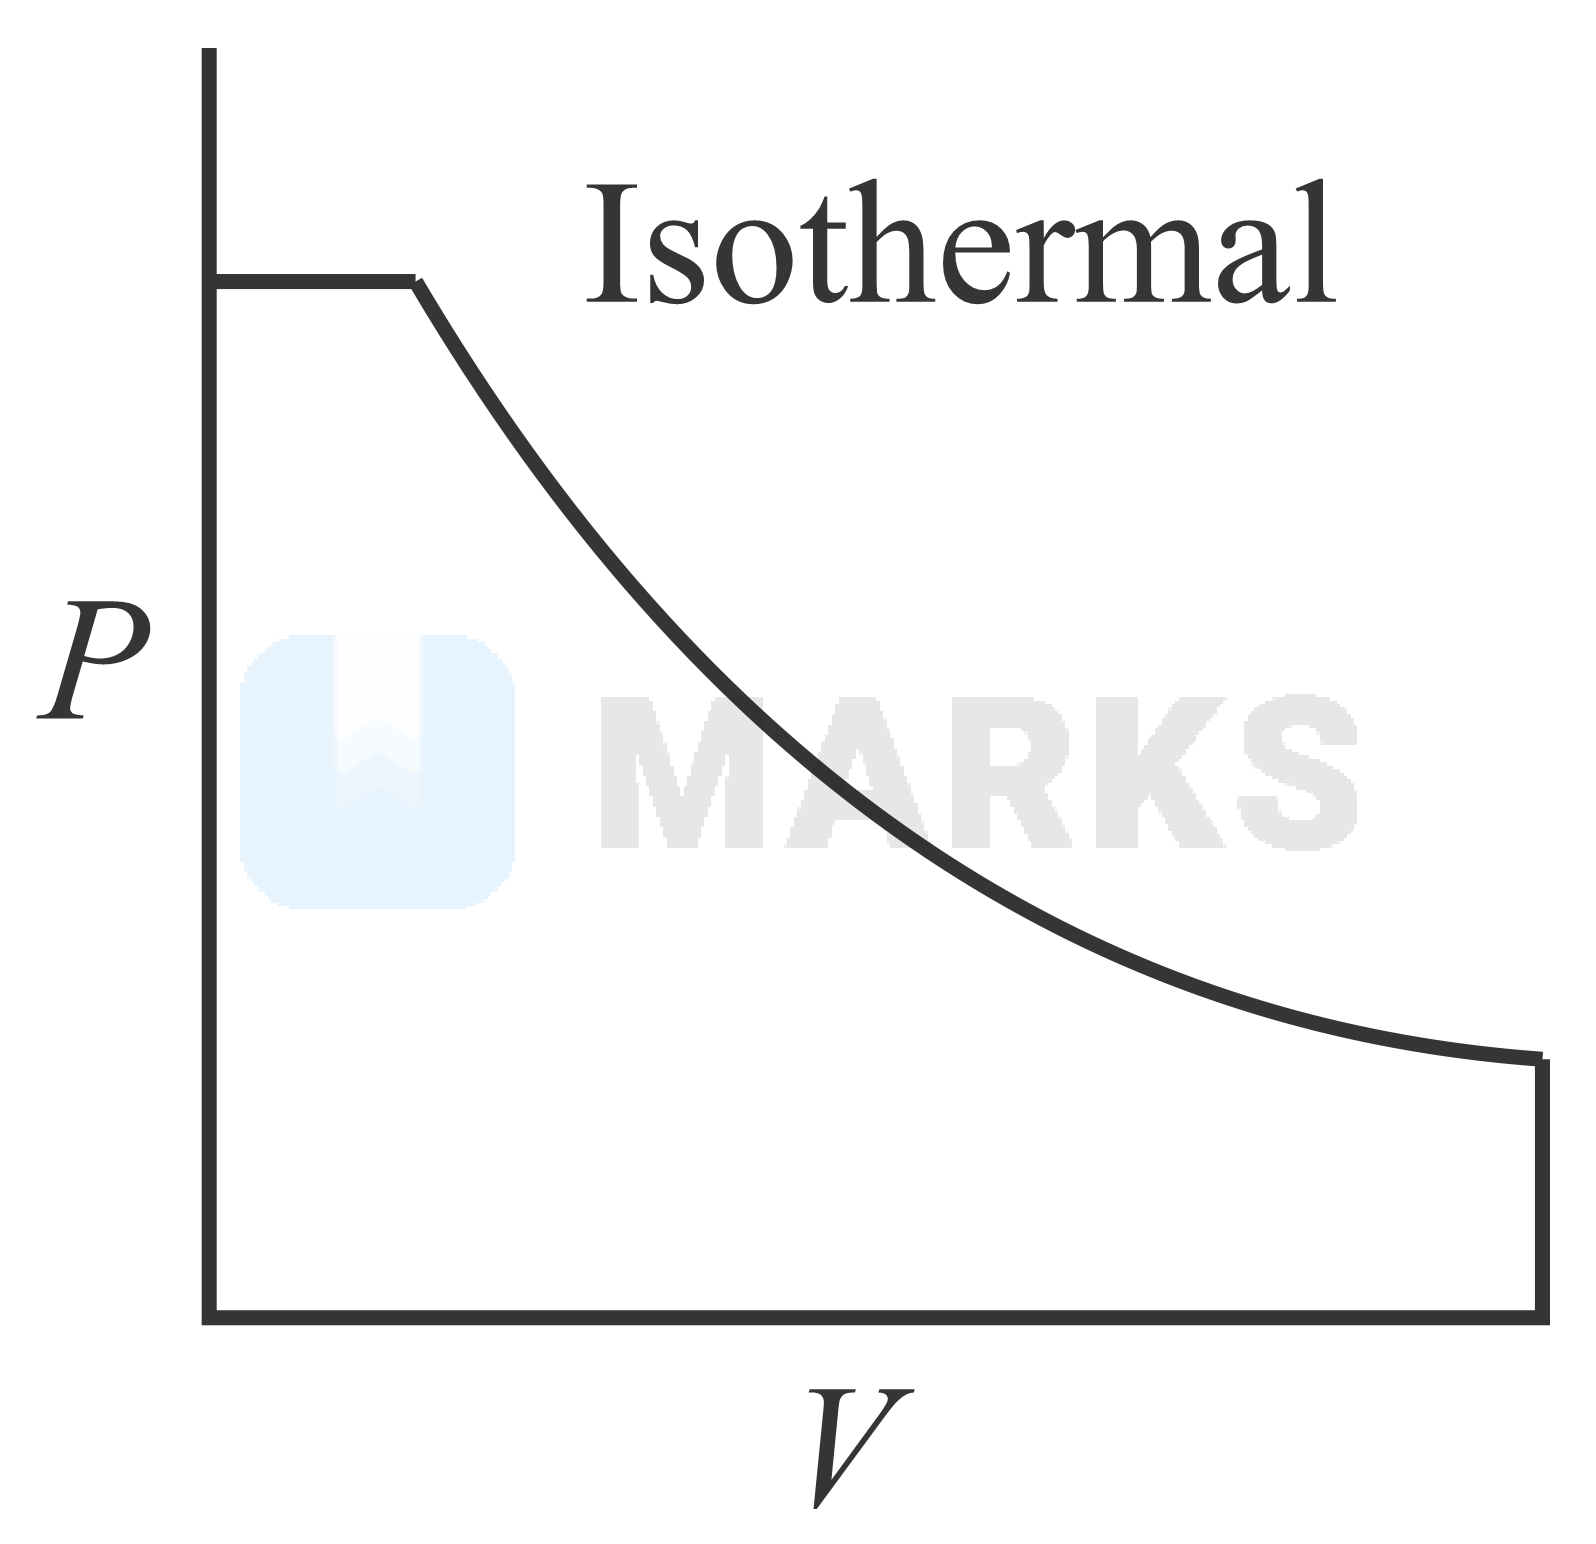
Which of the following curve represents maximum work done?
Options:
- A
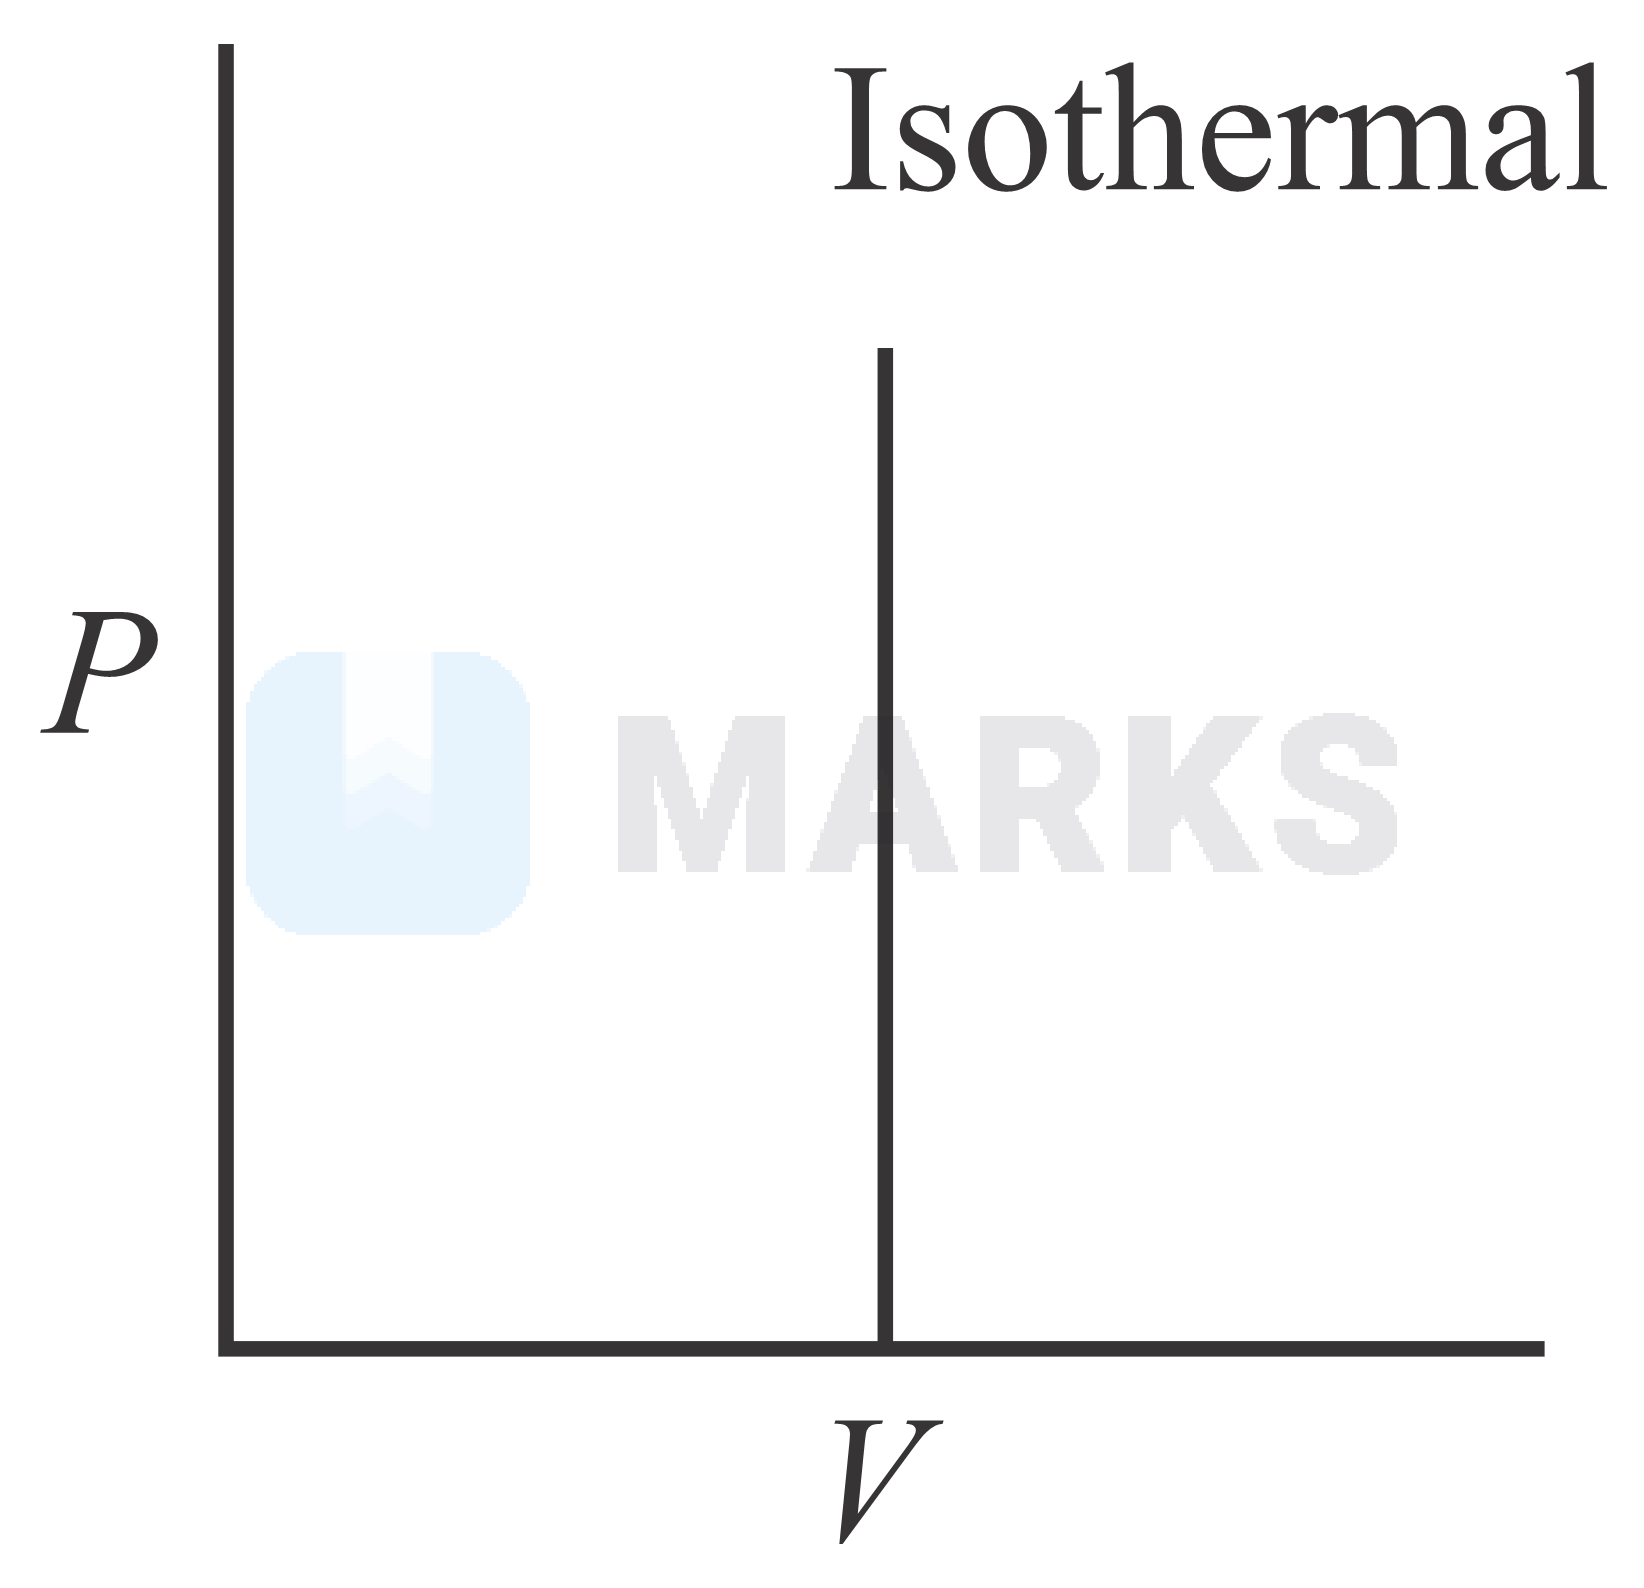
- B
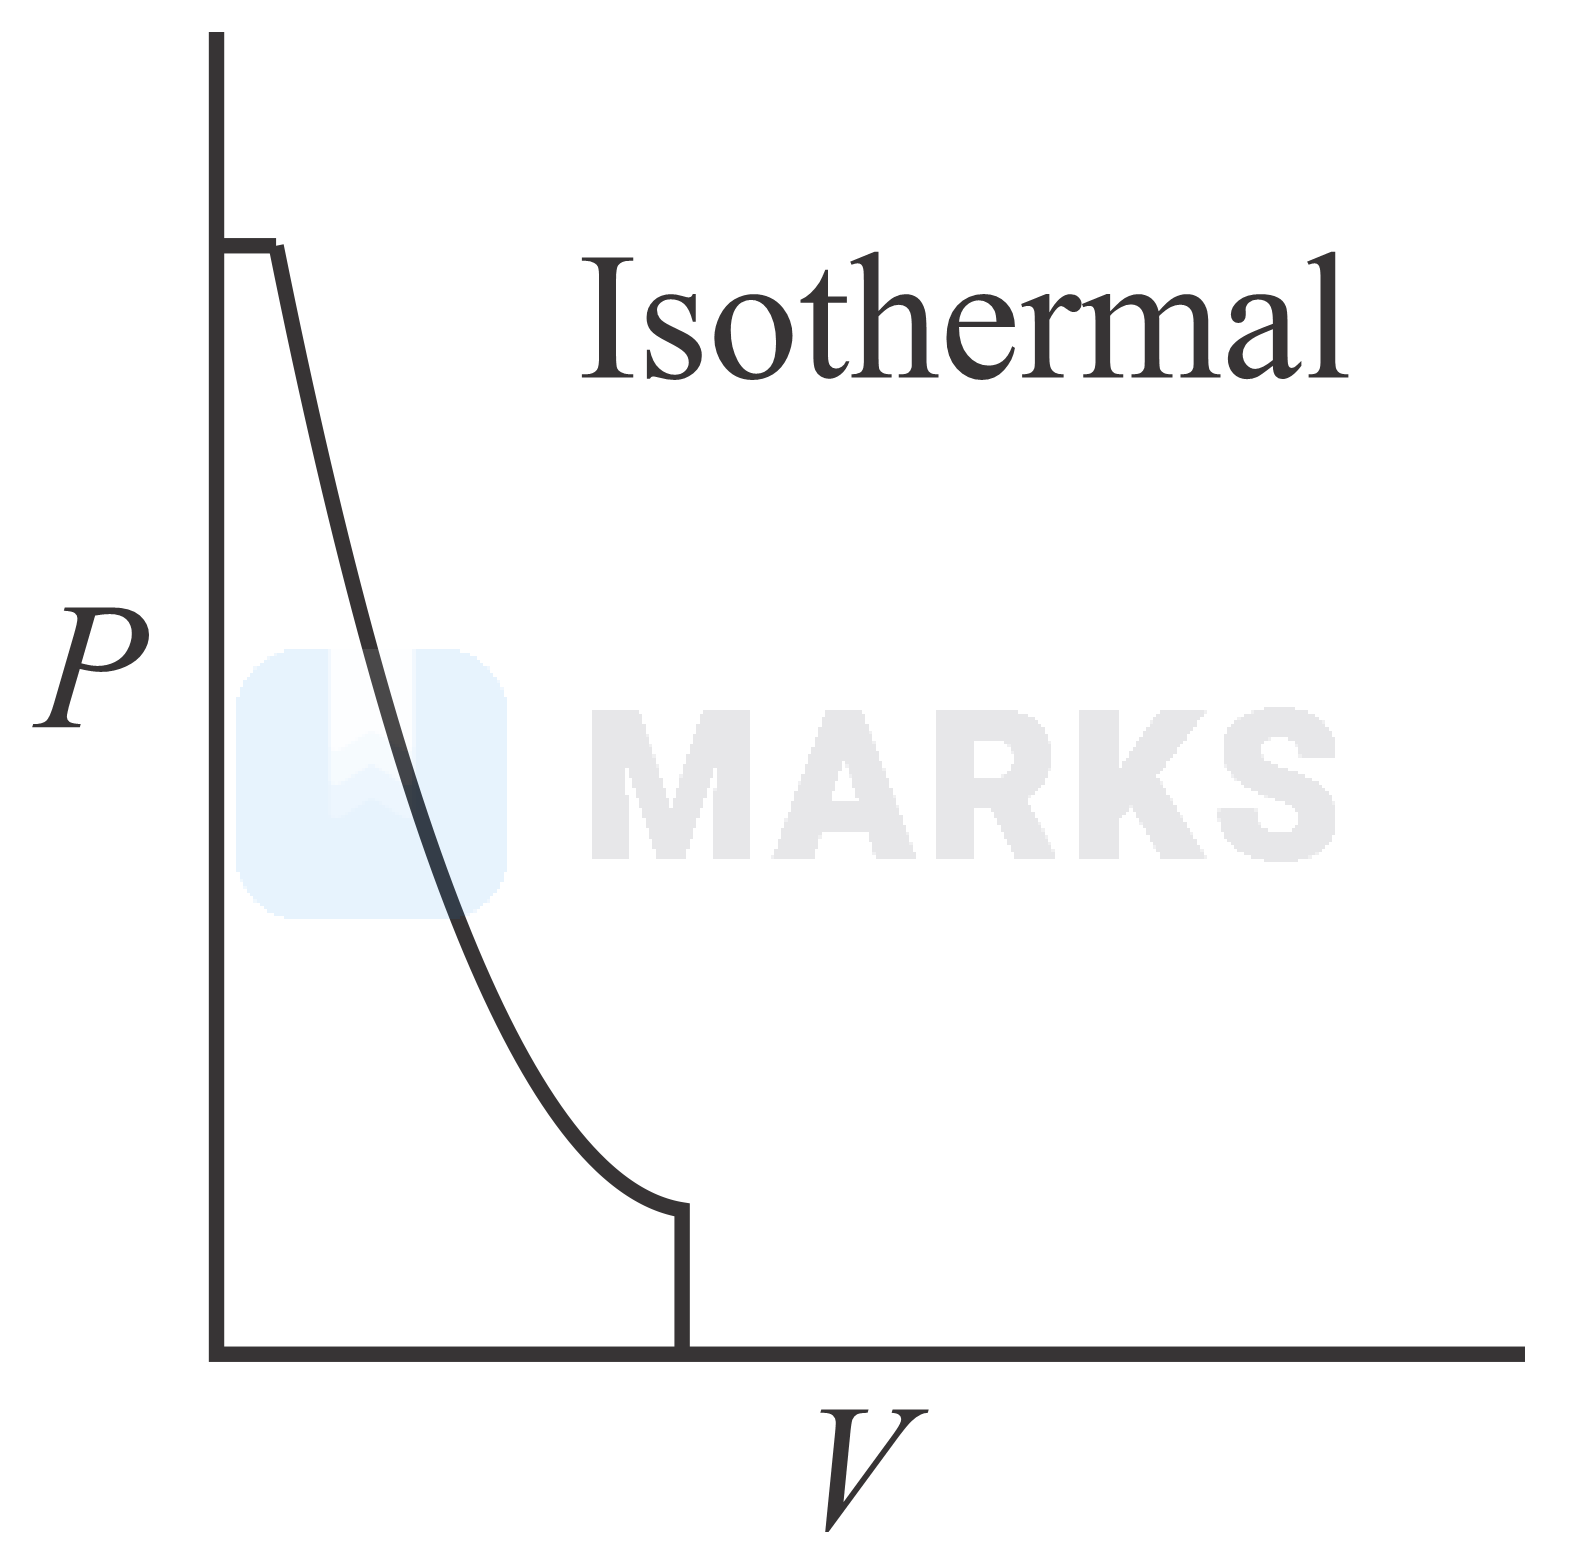
- C
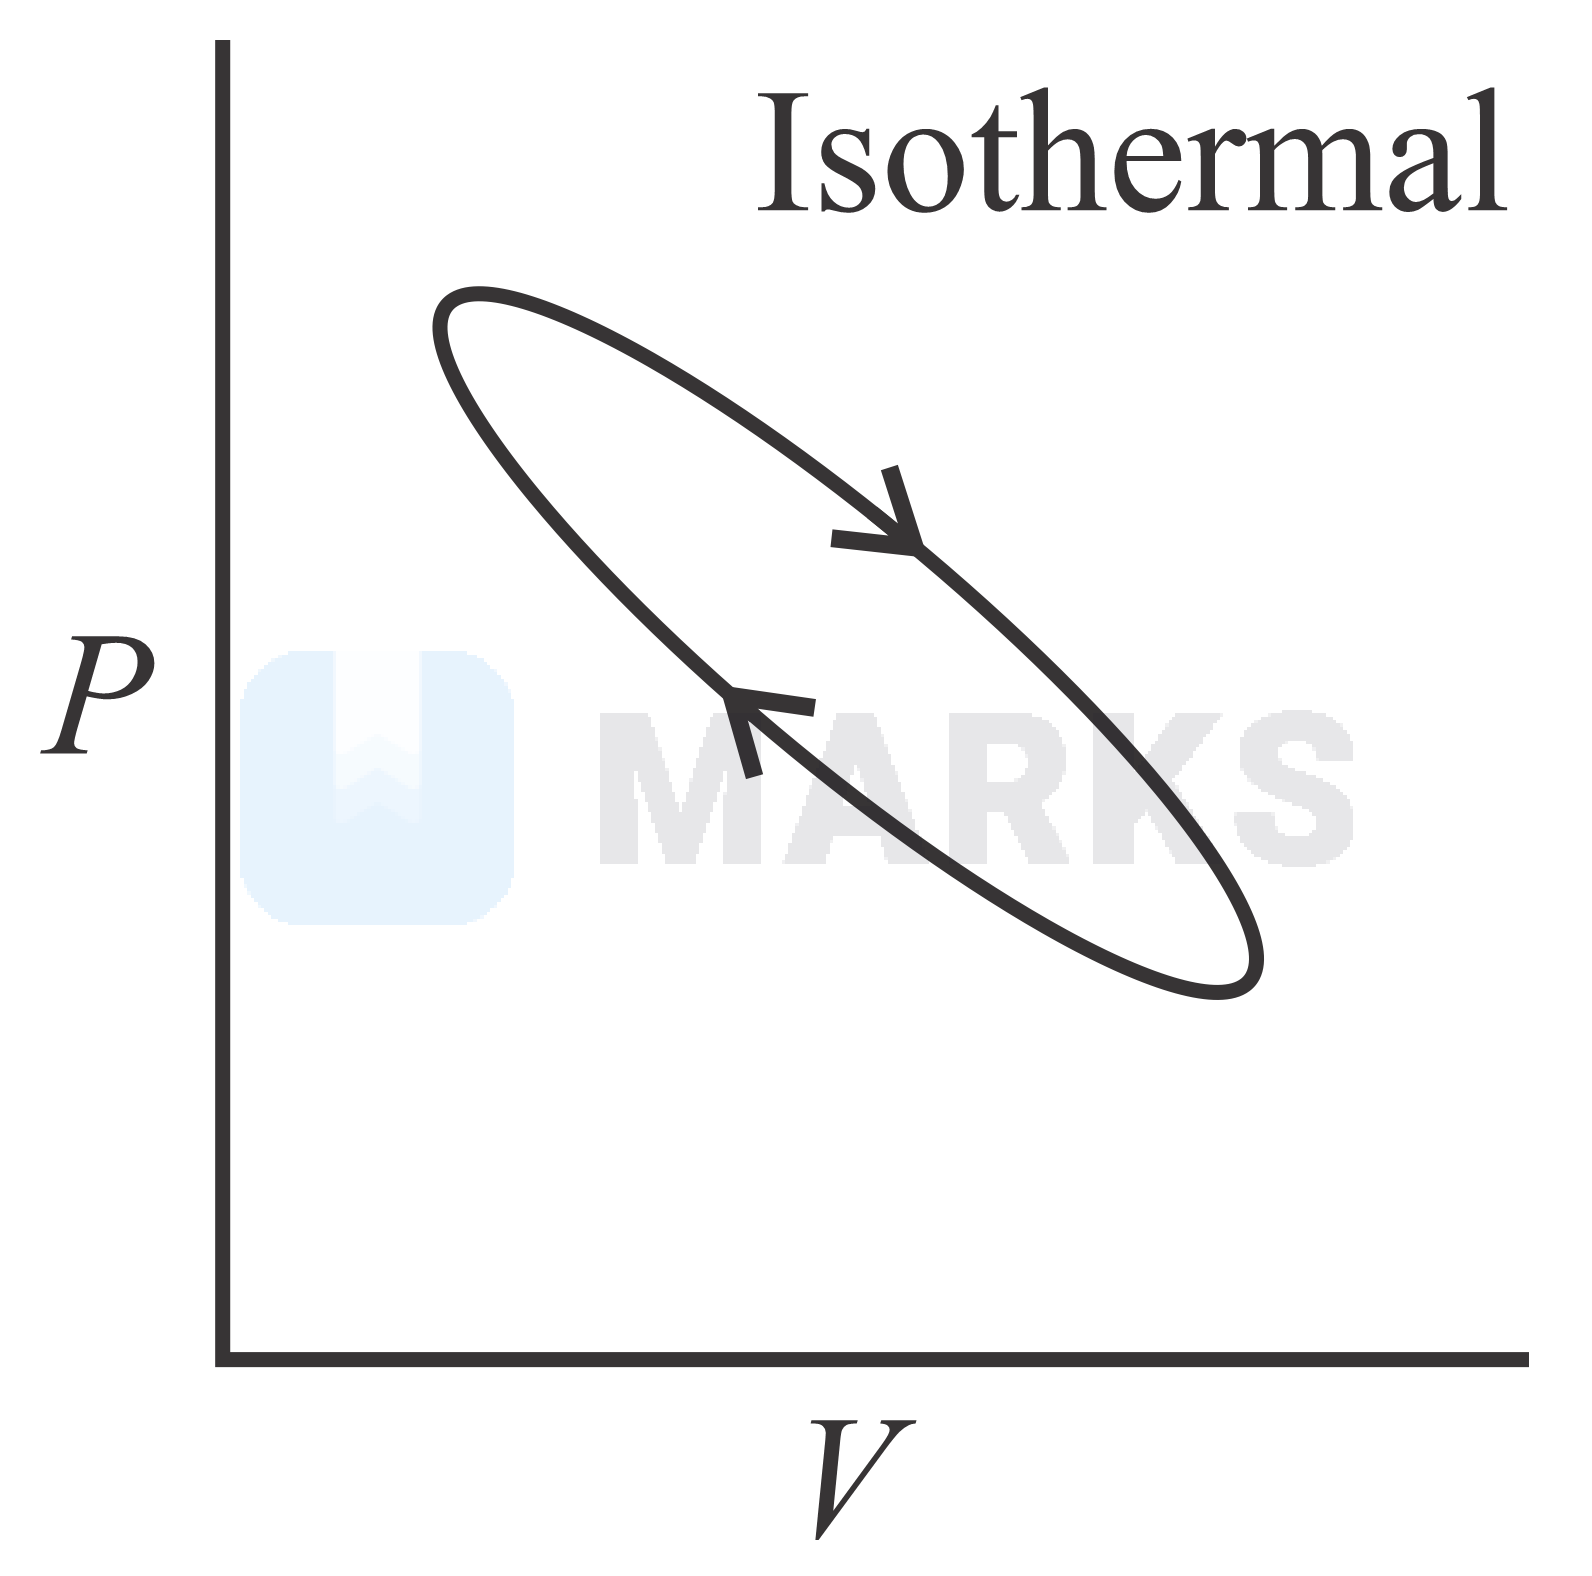
- D
Solution:
1220 Upvotes
Verified Answer
The correct answer is:
The area under the curve represents the work done. Work can be calculated by calculating area between P-V graph and volume axis. Among the given graphs, the area under the curve is maximum for graph A.
Option B represent isochoric process so, work done will be zero.
Option C and option D has less area under the curve.
Looking for more such questions to practice?
Download the MARKS App - The ultimate prep app for IIT JEE & NEET with chapter-wise PYQs, revision notes, formula sheets, custom tests & much more.